On June 11, 2026, the Russia–Ukraine war became the longest sustained military conflict in Europe since the Second World War.
The previous day, it had equaled the First World War’s duration — 1,568 days, from the guns of August 1914 to the Armistice of Compiègne. It has now surpassed that benchmark. The theory most confidently expected to prevent this outcome was not a military one.
It was economic: the belief, held with genuine conviction in Washington, Brussels, and London in early 2022, that the right combination of financial pressure could substitute for military resolution and compel a nuclear-armed major power to dump its pursuits. Four years of evidence have tested that belief. The verdict is instructive.
When Western governments deployed what senior officials described as a ‘financial nuclear option’ in February 2022 — freezing approximately $300 billion in Russian central bank assets and severing major Russian banks from the SWIFT interbank messaging system — the logic seemed coherent.
Russia’s heavy dependence on globalized finance and energy trade was framed as its critical vulnerability. The European Union followed with a phased embargo on Russian crude oil and pipeline gas.
The G7 introduced a $60-per-barrel price cap on Russian oil exports in December 2022. Export controls on semiconductors, aerospace components, and dual-use technologies were imposed to erode Russia’s precision munitions industry. By any historical measure, it was the most extensive economic blockade ever assembled against a major economy — over 16,000 individual and sectoral measures from more than thirty governments.
It did not produce the outcome its architects anticipated. Russia’s GDP contracted by 2.1 percent in 2022, recovered to 3.6 percent growth in 2023, expanded 4.3 percent in 2024, and slowed to 1.0 percent in 2025 as the Bank of Russia’s key interest rate — raised to 21 percent in October 2024 to combat war-driven inflation — began extracting a real toll on civilian activity.
Russian defense factories ran around the clock on three shifts. Unemployment dropped to record lows. The front lines held. And the war continued. To understand why, we need to look at the three main ways Russia absorbed the shock, adapted its economy, and turned a blockade meant to cage it into a burden it was willing to live with.
Sanctions have imposed costs on Russia. They have not imposed coercion. For a major power prepared to pay the price of isolation — and with enough of the non-Western world willing to keep the commercial door ajar — those are very different things.
Figure 1 Comparative Timeline: World War I vs. Russia–Ukraine War
| WORLD WAR I (1914–1918) | RUSSIA–UKRAINE WAR (2022–present) | |
| 28 Jul 1914
WWI begins; Austria-Hungary declares war on Serbia |
24 Feb 2022
Russia launches full-scale invasion of Ukraine |
|
| Sep 1914 Western Front stabilises into trench systems; movement ends |
Feb–Mar 2022
$300 bn reserves frozen; SWIFT severance; emergency rate 20% |
|
| Jul–Nov 1916
Battle of the Somme: ~1.2 million casualties; ~10 km gained |
Dec 2022 G7 oil price cap ($60/bbl) takes effect |
|
| Apr 1917 USA enters WWI (Day 988); Allied industrial depth tips |
Jun 2023
Ukraine counter-offensive launched; limited gains by year-end |
|
| Mar–Jul 1918
German Spring Offensives fail; Allied counter-offensives begin |
Aug 2024
PM Modi visits Kyiv — first Indian PM to do so since 1992 |
|
| 11 Nov 1918
Armistice signed. WWI ends on Day 1,568. |
10–11 Jun 2026
Ukraine war equals then surpasses WWI. Day 1,568↔ 1,569+ |
|
| Sources: ArmyInform / New Voice of Ukraine, June 10, 2026; The Bridge Chronicle, June 13, 2026; John Keegan, The First World War (Hutchinson, 1998); Institute for the Study of War (ISW) Ukraine Conflict Updates, 2022–2026; Ministry of External Affairs, Government of India, 2024. | ||
- The Resilience Loop
How Russia Turned an Economic Blockade into Adaptation
The first and most consequential failure of the sanctions regime was its inability to eliminate Russian energy revenues. When Europe ended its Russian crude and gas purchases — an achievement that carried a genuine economic cost — Moscow found willing buyers to the east with striking speed. According to the U.S.
According to the Energy Information Administration, Russia’s crude exports to India grew from roughly 50,000 barrels per day in 2020 to 1.7 million barrels per day in 2024, a 30-fold increase. China absorbed 2.2 million barrels per day in the same year.
Asia and Oceania’s combined share of Russian crude exports rose from 41 percent in 2020 to 81 percent in 2024 — while Europe’s share collapsed from 51 percent to 12 percent.
To circumvent the G7 price cap and Western maritime insurance restrictions, Russia assembled a shadow fleet of over 600 aging tankers operating under flags of convenience, enabling Russian crude to reach Asian buyers at above-cap prices and preserving the hard-currency flows that supported the war budget.
The financial response was equally consequential. Capital controls and an emergency 20 percent interest rate imposed within days of the February 24 invasion prevented the anticipated banking collapse. More durably, Russia accelerated its System for Transfer of Financial Messages — SPFS — as a domestic alternative to SWIFT, and expanded yuan-denominated trade settlement with China.
By 2024, the Chinese yuan had overtaken the US dollar as the most-traded foreign currency on the Moscow Exchange. In a single move, the West showed the world that even a country’s official reserves held in dollars could be frozen at the stroke of a pen. That was all the proof many non-Western central banks needed to start moving away from the dollar faster than ever. Ironically, the very tool meant to punish Russia is quietly undermining the system that gives it power.
The third mechanism is the one that most directly sustains the battlefield stalemate. SIPRI’s April 27, 2026 data confirm that Russia spent $190 billion on its military in 2025 — 7.5 percent of GDP, the highest share ever recorded in SIPRI’s database, representing the highest proportion of government expenditure Russia has devoted to defence since the Soviet period.
That massive state injection drove industrial production in metallurgy, heavy machinery, and munitions, pushed unemployment below 3 percent, and generated the shell and drone output that currently outpaces the combined production capacity of EU member states. The long-term costs are severe: persistent inflation exceeding 9 percent, a central bank rate held at 21 percent, and the emigration of an estimated half-million educated workers since 2022. But in the medium-term attritional calculus, it has done what the Kremlin needed it to do.
Table 1 Russia: Key Economic Indicators Before and After Sanctions (2021–2025)
| Indicator | 2021 | 2022 | 2023 | 2024 | 2025 |
| Real GDP Growth (%) | + 4.7 | − 2.1 | + 3.6 | + 4.3 | + 1.0 |
| Military Expenditure (USD bn) | $65 | $76 | $109 | $149 | ~$190 |
| Military Burden (% of GDP) | 3.9% | ~4.0% | 5.9% | 7.1% | 7.5% ▲ |
| Military Spend (% of Govt. Budget) | ~15% | ~17% | ~29% | ~35% | Highest ever |
| Bank of Russia Key Rate | 4.25% | 20%→7.5% | 16% | 21% | 21% |
| Russia crude to India (mbd) | ~0.05 | ~0.80 | ~1.80 | 1.70 | ~1.60 |
| Federal Budget Balance (% GDP) | +0.4% | −0.4% | −1.9% | −1.5% | −2.6% |
Sources: GDP: Rosstat, February 6, 2026; confirmed Trading Economics. IMF WEO April 2026. Military expenditure 2024: SIPRI press release, April 28, 2025 ($149 bn / 7.1% GDP). Military expenditure 2025: SIPRI press release, April 27, 2026; Cooper, SIPRI Insights 2026/2, March 2026 (7.5% GDP — highest ever in SIPRI database). Bank of Russia key rate: official decisions 2022–2025. India crude: EIA, August 7, 2025. Budget balance: Russian Federal Treasury / SIPRI.
| Chart 1 Russian GDP Growth vs. Major Sanctions Events (2021–2025)
Annual real GDP growth (%) — Rosstat 2026; IMF WEO April 2026 |
||||
| 2021 — Pre-war baseline |
|
+4.7% | ||
| 2022 — SWIFT + $300 bn reserves frozen |
|
−2.1% | ||
| 2023 — EU crude embargo + G7 price cap ($60) |
|
+3.6% | ||
| 2024 — Secondary sanctions; rate raised to 21% |
|
+4.3% | ||
| 2025 — 16,000+ measures; rate held at 21% |
|
+1.0% | ||
| Sources: Rosstat (Russia), February 6, 2026; Trading Economics, February 2026; IMF World Economic Outlook, April 2026. Key insight: GDP contracted only −2.1% in 2022 and recovered to +4.3% by 2024, driven by defence Keynesianism, not productive civilian investment. | ||||
- The WWI Parallel
Attrition in the Age of Drones and Transparent Battlefields
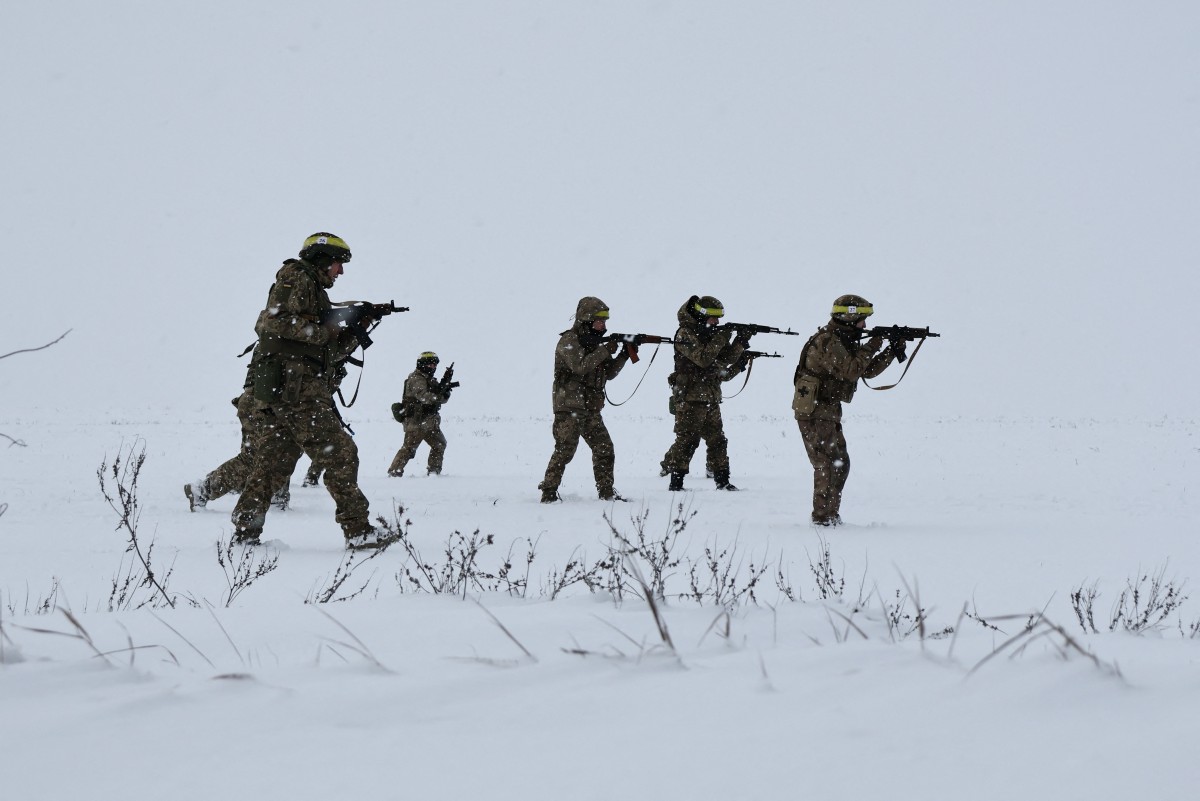
French military historian Michel Goya, interviewed by the New York Times in June 2026, observed that the Ukraine conflict most closely resembles the First World War of any conflict in the century. The diagnosis is not hyperbolic.
Trench systems stretching nearly a thousand kilometers, daily artillery exchanges at rates rivaling Verdun, and territorial gains measured in hundreds of meters: this is the operational grammar of industrial attrition that twentieth-century doctrine declared obsolete. Both conflicts ask the same fundamental strategic question — which economy can sustain losses longer — and in both cases, the answer has been decided as much in the factory as on the frontline.
The twenty-first-century difference is the transparent battlefield. Artificial intelligence, first-person-view drone surveillance, and real-time satellite imagery have made large-scale armored maneuvers nearly impossible — any concentration of forces is detected and engaged within minutes.
This actually makes the war even more attritional, not less. Modern drones and real-time surveillance mean big troop movements or surprise breakthroughs are almost impossible — the kind that finally ended the stalemate in 1918. Instead, everything gets spotted and destroyed almost instantly. Ukraine’s counter-offensives in 2023 and 2024 showed this the hard way, at terrible cost.
When fast maneuvers are no longer possible, the war becomes a brutal test of who can produce more weapons and absorb losses longer. The side with the stronger industrial base and deeper manpower usually wins.
The historical comparison also shows the sanctions regime’s structural flaw. The Allied naval blockade of Germany contributed to the 1918 Armistice partly because of its near-universality: few significant neutral economies maintained substantial commerce with the Central Powers. The Russia sanctions regime faces precisely the opposite condition.
States representing approximately 60 percent of global GDP by purchasing-power parity — including the world’s two most populous nations — declined to join the coalition. No enforcement innovation corrects that structural deficit. It is a feature of a multipolar world in which Western financial architecture stays effective but no longer determinative.
Table 2 World War I vs. Russia–Ukraine War: Structural Comparison
| Variable | World War I (1914–1918) | Russia–Ukraine War (2022–present) |
| Duration | 1,568 days (28 Jul 1914 – 11 Nov 1918) | 1,568 days equal June 10, 2026. 1,573+ days as of publication. |
| Mode of warfare | Industrial attrition; trench systems; mass infantry; poison gas; tanks (1916) | Digital-industrial attrition; trench systems (~1,000 km); FPV drones; AI targeting; EW suppression |
| Decisive technology | Tank (1916); aircraft; machine gun — tactically significant, not decisive until 1918 | FPV drones (~70% of frontline casualties, ISW); satellite ISR; AI fire-control |
| Economic coercion | Allied naval blockade; near-universal — few major neutral economies traded with Germany | 16,000+ Western sanctions measures; ~60% of global GDP-PPP outside the coalition (IMF, 2026) |
| Coercion outcome | German economic exhaustion + civilian unrest contributed to the 1918 Armistice | Russia adapted; no strategic withdrawal. War ongoing as of Day 1,573. |
| Displacement | ~6–10 million European refugees (Keegan; Strachan) | 6.5 million Ukrainian refugees abroad; 3.7 million internally displaced (UNHCR, 2025) |
Sources: WWI: ArmyInform / New Voice of Ukraine, June 10, 2026; Keegan, The First World War (Hutchinson, 1998); Strachan, The First World War (OUP, 2001). Drone casualties: ISW Conflict Updates, 2024–2026. GDP-PPP: IMF WEO, April 2026. UNHCR Ukraine Situation Report, 2025.
The Allied blockade of Germany succeeded in part because it was near-universal. The Russia sanctions regime is not. In a genuinely multipolar world, it cannot be. That is not a failure of execution. It is a verdict on the theory.
| Chart 2 Russian Crude Export Destinations: Europe vs. Asia (2020 vs. 2024)
Share of total Russian crude oil and condensate exports (%) by destination — EIA August 2025 |
||||
| Europe — 2020 |
|
51% | ||
| Europe — 2024 |
|
12% | ||
| China — 2020 |
|
~20% | ||
| China — 2024 |
|
~26% | ||
| India — 2020 |
|
<1% | ||
| India — 2024 |
|
~20% | ||
| Turkey + other Asia — 2020 |
|
~29% | ||
| Turkey + other Asia — 2024 |
|
~42% | ||
| Sources: EIA, “Russia’s oil exports have decreased modestly since 2022, shifting toward Asia,” August 7, 2025. Asia and Oceania: 41% (2020) → 81% (2024); Europe: 51% → 12%. Sub-shares within Asia are EIA estimates and approximate. | ||||
III. India’s Strategic Calculus
Modi’s Principled Autonomy and the Architecture of Dual-Track Diplomacy
No country’s response to the Russia–Ukraine war better illustrates the new strategic arithmetic of multipolarity than India’s under Prime Minister Narendra Modi. The conventional characterization of India’s stance — awkward fence-sitting driven by arms dependency and transactional energy interests — is both analytically thin and factually imprecise. The verified record tells a more sophisticated story.
The energy calculus was nationally rational. Russia offered substantial discounts on crude after Western sanctions disrupted its traditional European market. India, which imports approximately 87 percent of its crude requirements, took the commercially obvious decision.
Russia’s share of India’s crude oil imports surged from under 1 percent before the war to 35.9 percent in 2023–24 and 35.8 percent in 2024–25, with India importing approximately 1.7 million barrels per day in 2024. Total India–Russia bilateral trade reached a record $70.6 billion in 2024 — a more than fivefold increase over five years — with Russian exports to India at $65.7 billion and Indian exports rising 21 percent to $4.9 billion. The trade balance remains heavily asymmetric; both governments have set a $100 billion bilateral target by 2030.
More analytically significant than the energy arithmetic is the diplomatic geometry. India abstained on all seven United Nations General Assembly resolutions condemning Russia’s invasion — a regular exercise in what India’s Ministry of External Affairs has termed strategic autonomy. In July 2024, Prime Minister Modi visited Moscow, delivering a direct message on the war’s human cost in person.
Six weeks later, on August 23, 2024, he visited Kyiv — the first Indian prime minister to do so since India and Ukraine established diplomatic relations in 1992 — stood with President Zelensky at a memorial for children killed in the conflict, and presented India’s ‘Vasudhaiva Kutumbakam’ peace framework. No other major power maintains simultaneous credible access to both Moscow and Kyiv.
That positioning is not the by-product of neutrality; it is the outcome of four years of deliberate, costly, and frequently criticized dual-track diplomatic investment. In any eventual peace process requiring a trusted interlocutor, India has made itself the candidate.
Table 3 India under PM Modi: Policy Responses and Verified Outcomes (2022–2026)
| Domain | Policy Response | Verified Outcome | Primary Source |
| Energy Security | Normalized Russian crude; Rosneft–Nayara refinery expanded; rupee-rouble payment channels | Russia = India’s #1 crude supplier: 35.9% (2023–24); 35.8% (2024–25). ~1.7 mbd in 2024. | EIA, Aug 2025; Energy Institute 2025; CFR, Feb 2026 |
| Bilateral Trade | IRIGC-TEC; $100 bn by 2030 target set at Dec 2025 Putin–Modi summit | Record $70.6 bn bilateral trade in 2024 (+9.2% YoY). Indian exports: $4.9 bn (+21%). | MoCI, GoI, 2024–25; Embassy of India, Moscow; ORF, Nov 2024 |
| Strategic Autonomy | Seven UNGA abstentions; MEA: ‘dialogue and diplomacy over sanctions’ | No CAATSA sanctions imposed on India. Credibility maintained with Russia and the West. | MEA statements 2022–2026; U.S. State Dept. 2022–2026 |
| Dual-Track Diplomacy | Modi: Moscow (Jul 8–9, 2024) + Kyiv (Aug 23, 2024 — first Indian PM since 1992 diplomatic ties) | Only major power with credible access to both Moscow and Kyiv. Zelensky invited to India. | MEA; Kyiv Independent, Aug 2024; Gulf News, Aug 2024; Atlantic Council, Sep 2024 |
| G20 Leadership | India chaired G20 (2023); achieved unanimous Declaration on Ukraine language | G20 New Delhi Declaration: unanimous, Sep 9–10, 2023. Chatham House: ‘a genuine diplomatic achievement.’ | G20 Secretariat, 2023; MEA; Chatham House, Oct 2023 |
Sources: MEA: Ministry of External Affairs, GoI (mea.gov.in), 2022–2026. EIA: U.S. Energy Information Administration, August 7, 2025. CFR: Council on Foreign Relations, February 17, 2026. MoCI: Ministry of Commerce and Industry, GoI, Trade Statistics 2024–25. ORF: Observer Research Foundation, November 2024. G20: G20 India Secretariat, September 2023. Atlantic Council, September 4, 2024.
| Chart 3 India–Russia Bilateral Trade Expansion (USD billion, selected years)
Total trade and components — Indian Ministry of Commerce and Industry |
||||
| Total bilateral trade — 2019–20 |
|
$11 bn | ||
| Total bilateral trade — 2021–22 |
|
$13 bn | ||
| Total bilateral trade — 2023–24 |
|
~$65 bn | ||
| Total bilateral trade — 2024 (record) |
|
$70.6 bn | ||
| India imports from Russia — 2024 |
|
$65.7 bn | ||
| India exports to Russia — 2024 |
|
$4.9 bn | ||
| Sources: Ministry of Commerce and Industry, GoI, Trade Statistics 2024–25 (DGCI&S); Embassy of India, Moscow; Qatar Tribune, March 12, 2025; ORF, “A Deep Dive into India–Russia Economic Relations,” November 2024. | ||||
- Implications
What 1,573 Days Reveal About the Next Crisis
The strategic lesson of this conflict is precisely stated: sanctions are a legitimate and sometimes effective instrument of statecraft, but against a determined, resource-rich, nuclear-armed major power with access to non-Western markets and the political will to absorb pain, they cannot alone compel strategic reversal.
They can impose costs. They cannot impose capitulation. Russia in 2026 is technologically more degraded, economically more distorted, and geopolitically more isolated from Western capital than it would otherwise have been. Those are real long-term consequences. They are not, and cannot become, on the current trajectory, consequences sufficient to reverse a conflict the Kremlin has framed in existential terms.
The longer-term systemic consequence may be even more significant.
By weaponizing the reserve currency — freezing sovereign assets held in good faith in Western jurisdictions — Western governments have provided the strongest incentive in decades for non-Western central banks to diversify away from dollar-denominated holdings. The bypass infrastructure built during this crisis — SPFS, CIPS integration, non-Western shipping insurance, alternative payment rails — now exists, has been stress-tested, and will outlast the conflict by decades. Future sanctions regimes will operate in a more fragmented financial landscape with correspondingly reduced reach. The weapon is being permanently blunted by repeated use.
The most consequential question for Western strategy, accordingly, is not how to design a better sanctions package. It is how to build an international order that the rising powers of this century — India, Brazil, Indonesia, the Gulf states, and others whose commercial decisions determined whether this blockade held — have a genuine interest in defending, because it reflects their values and national interests alongside those of its architects.
That is a project measured in decades. It begins with the recognition that the era in which a Western-led coalition could impose complete economic isolation on a major power without effective means of bypassing it has ended. Designing for the world that is emerging, rather than deploying instruments built for the one that has passed, is the urgent and as-yet-unfinished strategic task.
- Vikas Bhardwaj is a scholar of international political economy, holding a Ph.D. and M.Phil. from the Center for Russian and Central Asian Studies, School of International Studies, Jawaharlal Nehru University (JNU), New Delhi.
- Contact the author at vikasbhardwaj@live.in
- Views Personal of the Author


